
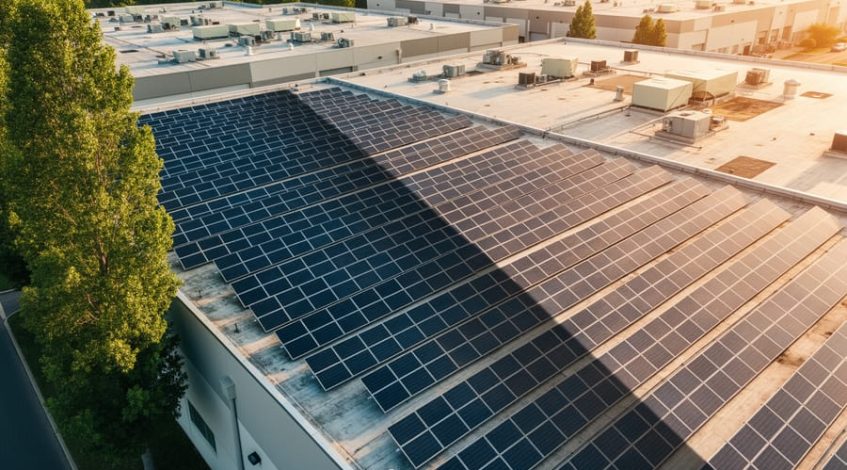
Shading factor represents the percentage of solar panel surface area obscured from direct sunlight during peak production hours—a metric that directly determines whether your solar investment achieves projected returns or underperforms by 10-40% annually. A single tree casting shadows across a 100-kilowatt commercial array can reduce energy generation by $3,000-$8,000 per year, transforming a seven-year payback period into a decade-long commitment.
Understanding this metric proves essential before signing solar contracts. Site assessments measuring shading factor account for obstructions including HVAC equipment, neighboring buildings, utility poles, vegetation, and rooftop infrastructure. Advanced solar pathfinder tools and drone-assisted 3D modeling now provide precise shading analysis across all seasons, identifying exactly when and where shadows will impact production throughout the year.
The financial implications extend beyond immediate energy losses. Shaded panels generate less voltage than unshaded modules within the same string, creating electrical mismatches that reduce overall system output. This cascading effect means 15% shading coverage rarely translates to just 15% production loss—actual losses typically reach 25-35% due to these electrical inefficiencies.
Commercial solar projects combat shading through strategic panel placement, microinverter or power optimizer technologies that isolate shaded modules, and proactive vegetation management protocols. Forward-thinking facility managers conduct quarterly shading audits, addressing new obstructions before they compound into significant revenue losses. Recent case studies demonstrate that facilities investing $2,500 in professional shading mitigation during design phases avoid $50,000+ in lost production over system lifetimes—a 20:1 return on preventive planning that separates successful solar implementations from disappointing ones.
What Is the Shading Factor and Why It Matters to Your Bottom Line
The Mathematics Behind Shading Losses
Understanding the financial impact of shading requires translating percentages into real-world energy losses. The shading factor directly correlates with production losses—a 15% shading factor typically results in approximately 15% reduction in annual energy generation, though the relationship can be non-linear depending on when shading occurs during peak production hours.
For a typical 100kW commercial installation generating 150,000 kWh annually, a 15% shading factor represents 22,500 kWh in lost production. At an average commercial electricity rate of $0.25 per kWh, this translates to $5,625 in annual revenue loss. Over a 25-year system lifespan, accounting for modest electricity price escalation of 2.5% annually, total lost revenue exceeds $180,000.
The impact extends beyond direct energy losses to affect system sizing and ROI calculations. A system designed without accounting for shading may never achieve projected payback periods. For instance, if a project pro forma assumes a 5-year payback based on unshaded production, a 15% shading factor extends this to approximately 5.9 years—a nearly 11-month delay that impacts financing decisions and investment attractiveness.
Commercial installations face additional complexity because shading rarely distributes evenly across arrays. Morning shading from eastern obstructions reduces production during lower-value off-peak hours differently than afternoon shading during peak demand periods, when electricity commands premium rates. Precise shading analysis using specialized software helps quantify these temporal variations for accurate financial modeling.
Disproportionate Impact: Why 10% Shading Doesn’t Mean 10% Loss
A common misconception among solar project evaluators is assuming that shading’s impact correlates linearly with the shaded area. In reality, 10% physical shading can reduce array output by 30-50% or more, creating disproportionate financial consequences for your investment.
This amplified impact stems from the series circuit configuration used in most solar installations. When panels connect in series, the weakest performer constrains the entire string’s output, similar to how a single slow vehicle limits traffic flow in a single-lane road. Even minimal shading on one panel forces all connected panels to operate at the reduced current level, dramatically curtailing overall production.
Consider a real-world scenario from a commercial warehouse installation in Sacramento: A ventilation unit casting shadows across just 8% of the array’s surface area resulted in a 42% reduction in morning energy production. The facility manager initially dismissed the shading as inconsequential, expecting less than 10% impact. After installation, monitoring data revealed the severity of production losses, necessitating a costly system reconfiguration with optimizers.
The non-linear relationship intensifies when shading affects multiple panels or occurs during peak production hours. Understanding this disproportionate impact is essential for accurate financial modeling and ensuring your solar investment delivers projected returns rather than disappointing underperformance.
Common Shading Sources That Undermine Commercial Solar Performance
Structural and Environmental Shading
Understanding how physical obstructions affect solar production requires examining both permanent structures and dynamic environmental factors. The shading factor of your solar installation depends significantly on architectural elements, neighboring properties, and natural landscape features that cast shadows across photovoltaic arrays.
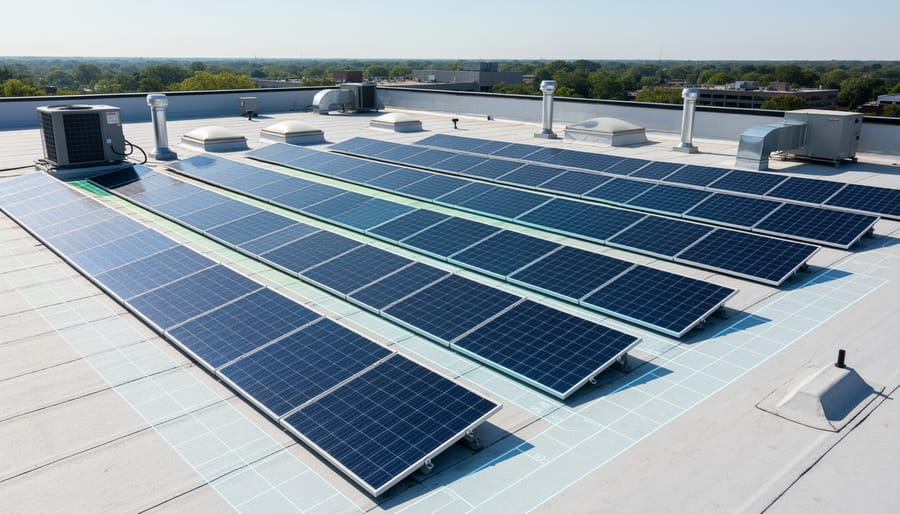
Building-related shading sources include rooftop equipment such as HVAC units, exhaust vents, skylights, and parapet walls. These fixed elements create predictable shadow patterns that qualified solar installers can model during the design phase. Commercial facilities often underestimate how rooftop infrastructure affects usable array space, potentially reducing system size by 15-30% compared to unobstructed roof areas.
Adjacent structures present another critical consideration. Neighboring buildings, particularly in urban business districts, cast shadows that vary by season and time of day. A comprehensive shading analysis maps these patterns across the year, identifying whether shadows primarily affect morning, midday, or afternoon production. Winter months typically experience more pronounced structural shading due to lower sun angles.
Vegetation creates the most dynamic shading challenge. Trees near your facility may seem insignificant initially but can substantially impact performance as they mature. A single tree with 10-foot annual growth can compromise array output within five years. Deciduous trees offer seasonal variation, providing partial shading relief during winter months when leaves fall, though evergreens maintain year-round impact.
Landscape planning requires balancing aesthetic preferences with energy production goals. Strategic tree placement, selective pruning schedules, and vegetation management agreements with neighboring properties help preserve both environmental benefits and solar performance over the system’s 25-30 year lifespan.
Temporal Shading Considerations
Understanding temporal shading patterns is essential for accurate ROI projections and system design in commercial solar installations. The sun’s position changes dramatically throughout the year, meaning shading impacts vary significantly across seasons and times of day.
During winter months, the sun follows a lower arc across the sky, creating longer shadows from obstacles like buildings, trees, and rooftop equipment. A structure that casts minimal shade in summer may create substantial coverage during winter, when energy production already faces challenges from reduced daylight hours. These seasonal performance variations can impact annual energy yields by 15-30% if not properly assessed during the planning phase.
Time-of-day considerations are equally critical for commercial operations. Morning and afternoon shading from adjacent structures affects different portions of your array, potentially impacting peak production periods when electricity demand and costs are highest. For businesses with time-of-use billing structures, shading during high-rate periods can disproportionately affect savings.
Professional shading analysis should employ solar pathfinder tools or software modeling that simulates sun positions throughout the entire year. This comprehensive approach reveals shading patterns across all seasons, allowing designers to optimize panel placement and tilt angles. For commercial facilities, conducting this analysis prevents costly miscalculations in energy production forecasts and ensures financing models reflect realistic performance expectations. Annual shading reports should factor into your investment decision, providing month-by-month projections that align with your operational needs and budget planning cycles.
Quantifying Shading Impact: Assessment Methods and Tools
Pre-Installation Shading Analysis
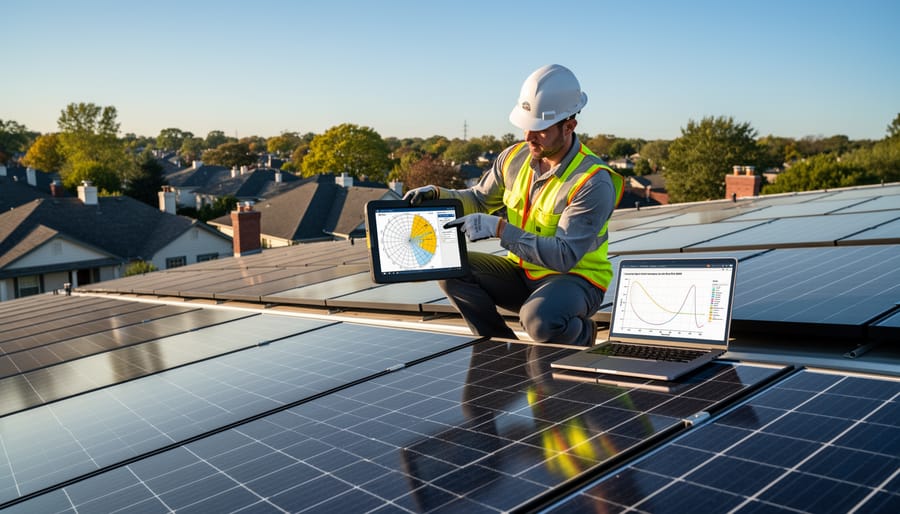
Professional solar installers employ sophisticated analytical tools to quantify shading losses before system deployment, ensuring accurate performance projections and ROI calculations. Solar pathfinders remain the industry standard for on-site assessment, capturing a hemispherical photograph of the sky above the installation area to map sun paths throughout the year. These handheld devices overlay solar trajectories onto actual site obstructions, calculating precise monthly shading percentages.
Advanced 3D modeling software has revolutionized pre-installation analysis by integrating satellite imagery, LiDAR data, and building specifications to simulate annual shading patterns. Programs like PVsyst and HelioScope generate hourly production estimates accounting for tree growth, seasonal variations, and environmental factors affecting performance. These platforms enable installers to test multiple array configurations and optimize panel placement before construction begins.
Comprehensive site surveys document existing and potential shade sources through time-stamped photography, drone imaging, and measurement of nearby structures. Professional assessments examine deciduous versus evergreen vegetation, neighboring development plans, and seasonal sun angle variations. Commercial projects typically require multi-day monitoring to capture changing shadow patterns across different times and weather conditions.
This thorough analytical approach provides facility managers with defensible performance guarantees and accurate financial projections, reducing uncertainty in capital investment decisions while identifying opportunities for design optimization that maximize long-term energy generation.
Post-Installation Monitoring
Implementing a robust monitoring system after installation provides critical insights into actual shading factor impacts on your solar investment. Modern monitoring platforms track real-time energy production at the panel, string, or inverter level, enabling facility managers to quickly identify performance anomalies that may indicate unexpected shading issues. These systems establish baseline performance metrics during optimal conditions, making it easier to detect gradual degradation caused by tree growth, new construction on adjacent properties, or accumulated debris.
Regular performance analysis reveals seasonal shading patterns that may not have been apparent during initial assessments. For commercial installations, quarterly performance reviews help quantify production losses and determine when mitigation measures become cost-effective. Advanced monitoring solutions can differentiate between shading-related losses and equipment malfunctions, preventing unnecessary service calls while flagging genuine environmental changes requiring attention.
Forward-thinking organizations integrate monitoring data with maintenance scheduling, addressing vegetation management and panel cleaning based on actual performance impact rather than arbitrary timelines. This data-driven approach optimizes operational expenses while maintaining maximum energy production, protecting your return on investment throughout the system’s 25-plus-year lifespan.
Strategic Mitigation: Design Solutions That Minimize Shading Impact
Optimal Array Placement and Orientation
Strategic array design begins with comprehensive site analysis to identify shading patterns throughout the year. Optimal panel placement requires evaluating roof structures, nearby buildings, and vegetation to determine zones with minimal shade exposure. Facility managers should consider tilt angles between 15-35 degrees for most Australian installations, adjusting based on latitude and seasonal energy demand profiles.
Row spacing calculations prevent inter-row shading, particularly critical during winter months when the sun sits lower in the sky. A general guideline allows spacing of 1.5 to 2 times the panel height at the winter solstice sun angle. Ground-mounted systems offer flexibility in orientation adjustments, while rooftop installations must work within existing structural constraints.
Array configuration choices directly impact return on investment. A commercial warehouse in Queensland achieved 94% shade-free operation by utilizing east-west orientations across multiple roof planes, avoiding shadow zones from HVAC equipment and skylights. This strategic layout delivered an additional 8% annual energy yield compared to initial single-orientation proposals, demonstrating how thoughtful positioning maximizes both space utilization and long-term financial performance.
Module-Level Power Electronics
Module-level power electronics (MLPE) represent a transformative approach to managing shading losses in commercial solar installations. Unlike traditional string inverters that process power from multiple panels collectively, MLPE solutions—specifically microinverters and power optimizers—operate at the individual panel level, effectively isolating shading impacts to only the affected modules.
Microinverters convert DC to AC power directly at each panel, ensuring that a shaded module doesn’t drag down the performance of unshaded panels in the same array. Power optimizers condition DC power at each module before sending it to a central inverter, maximizing each panel’s output independently. Both technologies typically recover 20-30% of energy that would otherwise be lost in partially shaded arrays, translating to significant revenue gains over a system’s 25-year lifespan.
For commercial applications, the cost-benefit analysis depends on site-specific shading conditions. MLPE systems typically add $0.15-$0.30 per watt to installation costs. However, facilities with unavoidable shading from neighboring structures, rooftop equipment, or seasonal tree coverage often achieve payback within 3-5 years through increased energy production. A distribution center in Oregon recovered an additional $18,000 annually after retrofitting power optimizers to address morning shade from adjacent warehouse buildings, demonstrating how MLPE technology transforms previously problematic sites into viable solar investments.
Advanced System Architectures
Large commercial installations can significantly reduce shading sensitivity through strategic electrical design. String configurations should be planned to group panels with similar shading profiles together, preventing a single shaded panel from compromising an entire array’s output. Modern bypass diodes, typically integrated at the panel level, create alternative current paths around shaded cells, maintaining power flow from unaffected portions of the system.
For facilities with unavoidable partial shading, power optimizers or microinverters offer module-level maximum power point tracking, allowing each panel to operate independently. This architecture proved effective at a 500-kilowatt warehouse installation where HVAC equipment created variable shading patterns throughout the day. The distributed power electronics maintained 92 percent system efficiency compared to an estimated 73 percent with traditional string inverter topology.
Central inverter systems benefit from dual or multi-string configurations that isolate shaded sections during peak production hours. When combined with proper site assessment during the design phase, these electrical solutions can reduce shading-related losses by 40 to 60 percent, directly improving project ROI and energy delivery consistency for commercial operations.
Physical Mitigation: Managing the Shading Environment
Vegetation Management Strategies
Proactive vegetation management represents one of the most cost-effective strategies for maintaining optimal solar array performance over time. Commercial facilities should implement scheduled tree trimming programs that occur at least annually, ideally before peak sunlight seasons. These programs prevent canopy overgrowth that gradually reduces system output, often by percentages that compound year after year.
Strategic tree removal decisions require balancing aesthetic considerations with financial returns. Conduct a professional shade analysis to identify which trees create the most significant performance impact. In many cases, removing or severely pruning one or two strategically positioned trees can recover 15-20% of lost generation capacity, dramatically improving project economics. Replacement with low-growth ornamental species maintains landscape appeal without compromising solar performance.
For new construction or major landscaping renovations, forward-thinking facility managers integrate solar considerations into landscape master plans from the outset. Position tall vegetation on the northern side of solar installations where shadows have minimal impact. Select species based on mature height projections and growth rates, ensuring compatibility with array placement for the system’s 25-30 year operational lifespan.
Document vegetation management commitments in operational plans to preserve solar investment value and maintain predicted energy savings throughout the project lifecycle.
Structural Modifications and Site Improvements
When obstructions create persistent shading issues that significantly reduce solar performance, structural modifications may represent the most cost-effective long-term solution. The decision to remove or relocate obstacles requires careful ROI analysis, weighing modification costs against projected energy gains over the system’s 25-30 year lifespan.
Trees represent the most common candidates for removal or strategic trimming. A commercial facility in Portland, Oregon increased annual production by 22% after removing two mature trees that cast afternoon shadows across 40% of their array. The $3,500 removal cost generated additional revenue of $2,800 annually, achieving payback in 15 months.
Building elements such as unused HVAC equipment, outdated antennas, or decorative structures should be evaluated for relocation potential. One warehouse operation relocated rooftop ventilation units for $8,200, eliminating shading that had reduced output by 18%. The modification paid for itself within three years while providing unobstructed production for decades.
Adjacent property negotiations occasionally yield results when neighboring structures cast problematic shadows. Purchasing air rights, negotiating setback agreements, or coordinating building modifications can resolve persistent shading challenges, particularly in urban environments where solar real estate commands premium value.
Permanent structural solutions typically demonstrate superior ROI compared to ongoing efficiency losses, particularly when shading affects high-value production hours or substantial array portions.
Real-World Performance: Case Studies in Shading Mitigation
Manufacturing Facility: Overcoming Adjacent Structure Shading
A Midwest manufacturing facility faced a challenging installation scenario when planning a 500 kW rooftop solar array. An adjacent warehouse structure created unavoidable shading across approximately 30% of the available roof space during morning hours, threatening to compromise the project’s financial viability.
Initial modeling revealed a shading factor of 0.42 for the affected sections, which would reduce overall system production by 18% compared to unshaded performance. This reduction translated to approximately $32,000 in lost annual revenue based on local utility rates and the facility’s energy consumption patterns.
Rather than abandoning the shaded sections, the engineering team implemented a two-part solution. First, they redesigned the array layout to concentrate higher-efficiency panels in partially shaded zones while optimizing string configurations to minimize current mismatch losses. Second, they deployed module-level power optimizers on panels experiencing intermittent shading, allowing each module to operate at its maximum power point independently.
This strategic approach recovered 14% of the projected energy losses, improving the shaded zone shading factor from 0.42 to 0.58. The power optimizer investment added $28,000 to upfront costs but generated an additional $19,600 in annual production value. With available tax incentives, the enhanced system achieved payback in 5.8 years versus 6.4 years for a configuration that simply avoided shaded areas.
The facility now generates 437 MWh annually, offsetting 62% of its energy consumption and demonstrating how informed mitigation strategies can transform constrained sites into viable solar investments.
Government Building: Vegetation Management Program Results
A municipal facility in Sacramento, California demonstrates the tangible value of proactive vegetation management for solar installations. The 500 kW rooftop array initially experienced a 23% reduction in energy production during its second year of operation due to unchecked tree growth from adjacent properties and public right-of-ways. This translated to approximately $18,400 in lost annual revenue based on local electricity rates and utility agreements.
Following stakeholder negotiations, the facility implemented a comprehensive five-year vegetation management program with an initial investment of $12,500 for strategic tree trimming and an ongoing annual maintenance budget of $3,200. The results validated the business case decisively. Within six months of the initial trimming, system performance recovered to 97% of design specifications, increasing annual energy production by 21% compared to the degraded baseline.
Over the five-year study period, the cumulative energy gains totaled $87,300, while total vegetation management costs reached only $25,300. This delivered a net benefit of $62,000 and a return on investment of 245%. Beyond financial metrics, the facility achieved greater budget predictability, eliminated emergency maintenance calls, and maintained consistent compliance with renewable energy certificate requirements.
The case underscores a critical principle for commercial solar stakeholders: addressing shading factors through systematic environmental management yields substantially higher returns than accepting gradual performance degradation. For facility managers evaluating solar projects, incorporating long-term vegetation maintenance into financial models ensures realistic projections and protects the investment’s full economic potential.
Making Informed Decisions: Evaluating Shading Trade-offs
Cost-Benefit Analysis for Mitigation Strategies
Evaluating mitigation strategies requires a systematic comparison of implementation costs against quantifiable energy benefits. Begin by calculating baseline energy losses from shading using your solar monitoring data or simulation software. For each proposed mitigation option, obtain detailed cost estimates including materials, installation, and ongoing maintenance.
Next, project annual energy gains from each strategy. Panel relocation might cost $5,000-$15,000 but recover 15-20% in lost production, while optimizers typically add $0.30-$0.50 per watt to system costs but can improve shaded panel output by 20-30%. Tree trimming represents a lower upfront investment of $500-$2,000 but requires recurring maintenance every 2-3 years.
Calculate payback periods by dividing total implementation costs by annual energy savings at your current electricity rates. Most commercial shading mitigation strategies achieve payback within 3-7 years, well within typical solar system lifespans of 25+ years. Factor in electricity rate escalation, typically 2-4% annually, which accelerates returns over time.
Consider lifecycle ROI by projecting cumulative savings over 20-25 years. A $10,000 investment recovering $2,000 annually delivers 400-500% returns over the system lifetime. Include avoided maintenance costs and potential production guarantees when comparing options.
For comprehensive financial modeling supporting solar investment decisions, explore resources on maximizing solar ROI. Document all assumptions and review annually as technology costs decline and efficiency improves.
Working with Professional Solar Partners
Selecting a qualified solar installer ensures comprehensive shading analysis becomes integral to your project’s success. Professional partners utilize industry-standard tools like PVsyst or Helioscope to conduct detailed site assessments, generating precise shading reports that quantify losses throughout the year. These analyses should include time-stamped visualizations showing how shadows move across your roof or ground-mount area during different seasons.
Expect transparent performance projections that account for identified shading factors rather than optimistic estimates. Reputable installers provide conservative energy production forecasts with shading losses clearly delineated in proposals, enabling accurate ROI calculations. They should explain mitigation options—from optimized panel placement to microinverter implementation—with corresponding cost-benefit analyses.
Post-installation support matters equally. Quality solar partners offer monitoring systems that detect shading-related underperformance and provide maintenance plans addressing vegetation growth or environmental changes. Regular performance reviews help identify emerging shading issues before they significantly impact returns. Request client references specifically regarding shading challenges to verify an installer’s problem-solving track record in similar commercial environments.
Understanding shading factor is essential for making informed commercial solar investment decisions, but it should not be viewed as an insurmountable barrier to achieving strong returns. Throughout this analysis, we’ve demonstrated that shading challenges are both quantifiable and manageable through systematic assessment and strategic mitigation approaches.
The key to maximizing your solar investment lies in conducting a comprehensive shading analysis during the initial feasibility phase. Professional-grade assessments using tools like Solar Pathfinder devices or advanced software modeling provide the precise data needed to forecast actual system performance and calculate realistic financial projections. This upfront diligence prevents costly surprises and ensures your business case is built on accurate assumptions.
Equally important is recognizing that modern solar technology and design strategies offer multiple pathways to minimize shading impacts. From microinverters and power optimizers to thoughtful panel placement and strategic vegetation management, today’s solutions deliver significantly better performance in partially shaded conditions than systems installed even five years ago. The warehouse case study highlighted earlier demonstrates that facilities with moderate shading can still achieve payback periods well within acceptable parameters for commercial investments.
For decision-makers evaluating solar projects, the recommendation is clear: engage qualified solar professionals who conduct thorough site assessments and provide transparent performance modeling that accounts for your specific shading conditions. Request detailed shading analyses, ask for multiple mitigation scenarios, and insist on guaranteed performance metrics. A reputable solar partner will view shading factor as a technical parameter to optimize rather than a reason to compromise on system quality or expected returns.
Take the next step by scheduling a professional shading evaluation for your facility today.