
Establish performance baselines within the first 90 days of system operation by measuring actual energy production against modeled predictions, documenting any deviations exceeding 5% for immediate investigation. Solar installations typically deliver peak performance in year one, but without systematic monitoring, efficiency degradation of 15-25% over a decade often goes undetected until financial returns fall short of projections.
Implement quarterly Measurement and Verification (M&V) protocols following IPMVP guidelines to track equipment degradation, soiling losses, and inverter performance trends before they compound into significant revenue losses. Studies show that facilities with active M&V programs maintain 92-96% of projected savings over 20 years, compared to just 75-82% for passively managed systems.
Document environmental and operational changes that impact generation capacity, including new shading from adjacent construction, modified utility rate structures, or altered consumption patterns that shift the value of self-generated power. These external factors can reduce realized savings by 10-30% even when equipment functions perfectly.
Integrate automated alerts tied to specific performance thresholds rather than relying on monthly utility bill reviews, enabling intervention within days instead of months when inverters fail, connections degrade, or modules underperform. The difference between identifying a 20% production loss in week one versus month six represents thousands in unrecoverable revenue.
Schedule preventive maintenance based on actual performance data rather than arbitrary calendar intervals, optimizing service costs while preventing the gradual efficiency erosion that transforms a 25-year asset into a financial disappointment by year fifteen.
The Truth About Solar Energy Savings Over Time
What Savings Persistence Actually Means
Savings persistence refers to the capacity of energy efficiency and generation systems to maintain their projected performance levels throughout their operational lifetime, typically 25-30 years for solar installations. Understanding this concept is essential for maximizing your solar investment and achieving anticipated returns.
Several degradation factors can impact savings persistence. Solar panels typically experience an annual degradation rate of 0.5-0.8%, meaning a system operating at 100% capacity in year one may perform at approximately 80-85% by year 25. Additional factors include inverter efficiency decline, soiling and environmental impacts, and potential equipment failures. Component wear, wiring resistance increases, and thermal cycling also contribute to gradual performance reduction.
Realistic expectations are crucial for accurate financial planning. While manufacturers often guarantee 80% performance after 25 years, actual field performance varies based on installation quality, maintenance practices, and environmental conditions. Forward-thinking facility managers account for these degradation patterns when calculating long-term savings projections, ensuring their business cases reflect achievable outcomes rather than optimistic estimates that may underdeliver.
The Real Cost of Degraded Performance
Solar system performance degradation directly impacts your bottom line in ways that accumulate significantly over time. Industry data shows that even a seemingly modest 1% annual degradation rate translates to a 22% reduction in energy production over a typical 25-year system lifespan. This compounds the financial impact far beyond initial calculations.
According to National Renewable Energy Laboratory research, most crystalline silicon modules degrade at approximately 0.5-0.8% annually under normal conditions. However, systems experiencing accelerated degradation due to inadequate maintenance or component failures can see rates exceeding 1.5% per year. For a commercial installation projected to save $50,000 annually, the difference between 0.5% and 1.5% degradation represents nearly $180,000 in lost savings over two decades.
A manufacturing facility in the Midwest discovered their five-year-old solar array was underperforming by 12% due to undetected micro-cracks and connection issues. The delayed identification cost them approximately $68,000 in unrealized savings before corrective action restored optimal performance. This case illustrates why systematic monitoring becomes essential for protecting your investment’s value proposition and ensuring projected returns materialize throughout the system’s operational lifetime.
Why M&V Is Your Long-Term Savings Insurance Policy
The Four Pillars of Effective M&V Programs
Successful measurement and verification programs rest on four interconnected pillars that work together to safeguard your solar investment’s long-term financial performance.
The first pillar, baseline establishment, creates the reference point against which all future savings are measured. This involves documenting pre-installation energy consumption patterns, utility rates, operational schedules, and weather normalization factors. Without an accurate baseline, quantifying actual savings becomes speculative rather than scientific. Leading organizations typically collect at least 12 months of pre-installation data to account for seasonal variations and operational cycles.
Ongoing performance monitoring forms the second pillar, providing continuous visibility into system output and building energy consumption. Modern monitoring platforms track production at the inverter level, identify underperforming arrays, and alert facility managers to anomalies in real-time. This continuous surveillance enables rapid detection of issues before they significantly impact savings accumulation.
The third pillar, data analysis and reporting, transforms raw performance data into actionable intelligence. Regular reports comparing actual versus predicted savings help stakeholders understand whether their investment is meeting financial projections. Advanced analytics can isolate the impact of weather variations, operational changes, and equipment degradation, providing clarity on the true drivers of performance changes.
Corrective action protocols complete the framework as the fourth pillar. Establishing clear procedures for responding to performance deviations ensures that identified issues receive prompt attention. These protocols should define responsibility assignments, response timeframes, and escalation procedures. For example, when monitoring detects a 5% production drop, protocols might trigger immediate investigation, with remediation required within 72 hours.
Together, these four pillars create a comprehensive system that detects threats to savings persistence early and enables swift corrective measures, protecting the return on investment throughout the system’s operational life.
International Performance Measurement Protocol (IPMVP) Standards
The International Performance Measurement and Verification Protocol (IPMVP) has emerged as the globally recognized framework for quantifying energy savings with precision and transparency. Developed by the Efficiency Valuation Organization (EVO), IPMVP provides standardized methodologies that enable organizations to measure and verify the actual performance of energy conservation measures, including commercial solar installations.
For business owners and facility managers investing in solar energy systems, IPMVP offers a credible approach to documenting savings throughout the system’s operational life. The protocol establishes four distinct measurement and verification options, each tailored to different project scales and measurement requirements, ensuring flexibility while maintaining rigorous standards.
IPMVP’s relevance to commercial solar extends beyond simple performance tracking. The framework creates a common language between stakeholders, enabling clear communication between building owners, energy service companies, and financial institutions. This standardization proves particularly valuable when securing performance-based financing or demonstrating compliance with sustainability mandates.
By following IPMVP guidelines, organizations can generate independently verifiable evidence of their solar system’s financial returns, supporting informed decision-making and building confidence in long-term energy investments. This credibility becomes essential when justifying capital expenditures to boards, shareholders, or government agencies requiring documented proof of fiscal responsibility and environmental stewardship.
Common Threats to Long-Term Solar Savings
System Degradation and Component Failure
Solar panel performance naturally declines over time, with most crystalline silicon panels experiencing degradation rates between 0.5% and 0.8% annually. This means a system producing 100 kW in year one might generate approximately 90-92 kW after 25 years. While manufacturers typically guarantee 80-85% output after 25 years, actual degradation varies based on installation quality, environmental conditions, and panel technology.
Inverter failures present a more immediate concern, as these critical components typically require replacement every 10-15 years. A commercial facility that experienced inverter failure at year 12 saw production losses of 23% over three months before diagnosis and replacement, significantly impacting projected savings. Beyond inverters, wiring degradation, connection corrosion, and micro-cracking in panels can reduce system efficiency by 2-5% before detection.
Understanding these degradation patterns enables proactive intervention strategies. Regular monitoring helps identify when performance dips below expected degradation curves, signaling potential issues requiring attention. For business owners and facility managers, this knowledge transforms maintenance from reactive expense to strategic investment, ensuring long-term savings remain on target throughout the system’s operational lifetime.
Environmental and Operational Factors
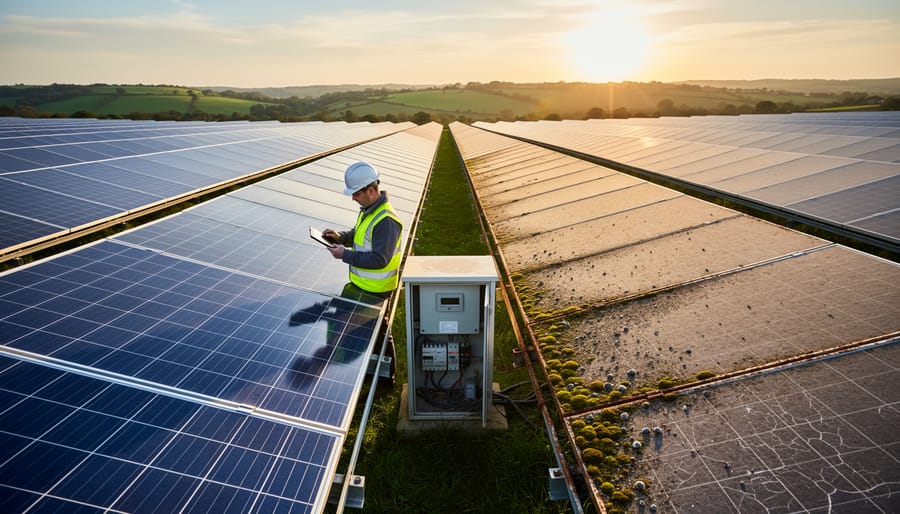
Environmental conditions significantly influence solar system performance and long-term savings potential. Soiling from dust, pollen, and airborne pollutants can reduce panel efficiency by 5-25% annually if left unaddressed, with commercial rooftops in industrial areas experiencing the highest accumulation rates. A logistics facility in Rotterdam documented a 17% output decline over eight months due to accumulated particulate matter before implementing quarterly cleaning protocols.
Vegetation growth presents another persistent challenge. Trees and landscaping that initially posed no threat can mature to cast shadows across arrays, reducing production capacity. A California retail center experienced a 12% annual energy reduction when perimeter trees grew to shade portions of their parking canopy system during peak afternoon hours.
Weather patterns also affect performance over time. Locations experiencing increased cloud cover, humidity fluctuations, or temperature extremes may see gradual efficiency shifts. Snow accumulation in northern climates can temporarily eliminate production, while prolonged heat exposure accelerates degradation rates.
Operational modifications compound these environmental factors. Facility expansions, new HVAC installations, or adjacent construction projects can introduce shading or alter consumption patterns. Regular monitoring through measurement and verification programs enables facility managers to identify these issues promptly, quantify their financial impact, and implement corrective measures before minor problems erode substantial savings.
The Hidden Impact of Grid Changes and Rate Structures
Solar system performance represents only one variable in the long-term savings equation. Utility rate structures evolve significantly over system lifespans, fundamentally altering the value proposition of your solar production. Many facilities have experienced reduced returns despite stable system output due to changes in feed-in tariffs, time-of-use pricing adjustments, or the introduction of demand charges that solar generation alone cannot mitigate.
Commercial solar installations face particular exposure to grid interconnection policy shifts. Network service providers periodically revise export limitations, capacity fees, and grid connection charges—modifications that directly impact revenue streams from excess generation. Understanding these policy impacts on returns enables proactive financial modeling and system optimization strategies.
Demand charges present a specific challenge, as they respond to peak consumption rather than total energy use. A commercial facility may substantially reduce energy consumption through solar while seeing minimal savings improvement if demand spikes occur during low-production periods. Regular measurement and verification protocols identify these dynamics, allowing facility managers to implement load-shifting strategies or energy storage solutions that preserve financial performance despite evolving rate structures.
Building a Savings Persistence Strategy That Actually Works
Implementing Continuous Performance Monitoring
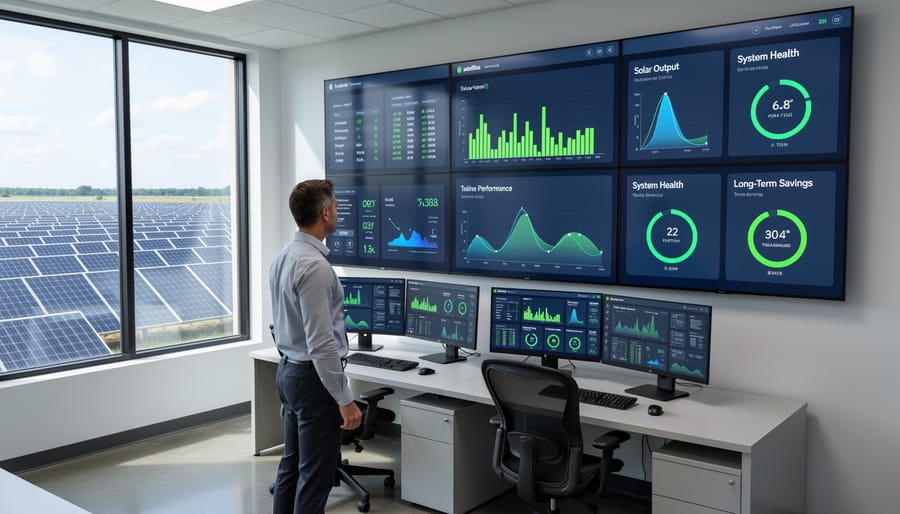
Effective continuous performance monitoring requires integrated technology solutions that track system output against expected performance baselines. Modern AI-powered monitoring systems collect data from inverters, weather stations, and utility meters at 5-15 minute intervals, providing granular visibility into system operations.
Key performance indicators to monitor include energy production versus predicted output, system availability percentage, inverter efficiency rates, and performance ratio calculations that account for environmental conditions. Tracking these metrics reveals degradation patterns, equipment failures, and optimization opportunities before they significantly impact savings.
Establish alert thresholds at 5-10% below expected performance to trigger immediate investigation. Configure notifications for equipment downtime exceeding 2 hours, unexpected drops in string-level output, and inverter communication failures. This proactive approach prevents minor issues from becoming costly problems.
Data visualization platforms should present information through intuitive dashboards displaying real-time generation, historical trends, and comparative analysis across multiple time periods. Color-coded heat maps identifying underperforming arrays and automated monthly performance reports enable facility managers to make informed maintenance decisions without requiring specialized technical expertise. Integration with existing building management systems creates a unified view of facility operations, simplifying oversight and accelerating response times when performance deviates from expectations.
Scheduled Maintenance and Preventive Interventions
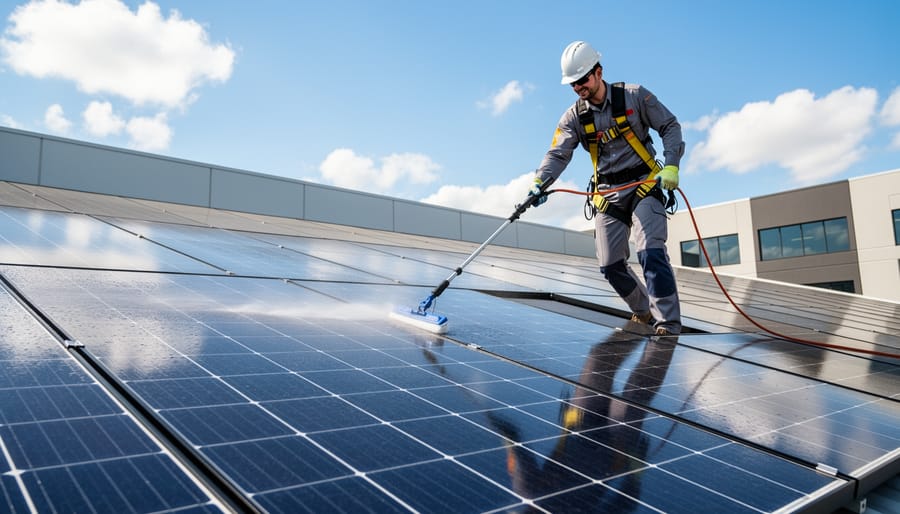
Protecting your solar investment requires systematic maintenance protocols that safeguard performance and preserve long-term savings. Commercial solar systems demand structured maintenance schedules encompassing quarterly visual inspections, semi-annual cleaning protocols, and annual electrical testing to maintain optimal output.
Panel cleaning frequency depends on environmental conditions, with dusty or industrial environments requiring quarterly attention while cleaner locations may extend to semi-annual schedules. Professional cleaning typically costs $0.15-$0.30 per watt of capacity but prevents degradation that can reduce output by 15-25% in neglected systems. Electrical testing should include infrared thermography to identify hot spots, insulation resistance testing, and performance ratio analysis comparing actual versus expected generation.
Preventive interventions deliver measurable returns. A manufacturing facility in Germany implementing comprehensive quarterly inspections discovered micro-cracks affecting 3% of panels, addressing the issue before capacity losses exceeded €12,000 annually. Similarly, scheduled inverter maintenance extending equipment lifespan by just two years eliminates €25,000-€40,000 in premature replacement costs for commercial installations.
Documentation proves essential for verifying that maintenance protects projected savings. Establish maintenance contracts with certified providers who deliver detailed service reports, enabling measurement and verification systems to distinguish between normal degradation and preventable performance losses, ensuring your financial projections remain accurate throughout the system’s operational life.
Annual M&V Reporting and Performance Benchmarking
Formal annual Measurement and Verification (M&V) reporting transforms raw performance data into actionable intelligence for stakeholders and financial documentation. These comprehensive reports compare actual energy production and cost savings against initial projections, providing transparent accountability for solar investments. Annual M&V reports typically include trend analysis that identifies performance variations over time, weather-normalized comparisons to establish true operational efficiency, and detailed financial summaries documenting realized savings.
For organizations implementing comprehensive building efficiency strategies alongside solar installations, these reports become essential for tracking cumulative benefits and informing future capital planning decisions. The documentation serves multiple critical functions: satisfying lender requirements for financed projects, supporting sustainability reporting obligations, validating energy performance contracts, and providing evidence for renewable energy certificates or carbon offset programs.
Regular benchmarking against industry standards and similar installations helps identify whether your system performs competitively or requires optimization. Many organizations leverage annual M&V reports during board presentations, sustainability disclosures, and stakeholder communications, transforming technical data into compelling narratives about environmental stewardship and fiscal responsibility. This formal verification process ensures that promised long-term savings remain quantifiable, defensible, and aligned with organizational objectives throughout the system’s operational lifetime.
Real-World Results: Case Studies in Savings Persistence
Real-world data demonstrates the substantial financial impact of implementing comprehensive measurement and verification strategies alongside commercial solar installations. Consider three contrasting scenarios from Australian commercial facilities over extended operational periods.
A 500kW manufacturing facility in Melbourne implemented a rigorous M&V program from day one, including quarterly performance audits, annual inverter optimization, and systematic panel cleaning schedules. Over ten years, this system maintained 94% of its projected energy production, delivering accumulated savings of $847,000 against an initial investment of $425,000. The facility’s proactive approach to solar for manufacturing operations included real-time monitoring with automated alerts, enabling rapid response to performance anomalies. Their return on investment reached 199% by year ten, with projected savings extending well beyond the system’s 25-year lifespan.
In contrast, a similarly-sized warehouse installation in Sydney opted for minimal oversight after commissioning. Without systematic M&V protocols, the facility experienced undetected inverter degradation in year three and accumulating soiling losses. By year eight, production had declined to 71% of original projections. While the initial investment was comparable at $418,000, actual savings totaled only $492,000 over the same ten-year period, representing a mere 118% ROI. The facility eventually invested an additional $35,000 in remediation and system upgrades to recover lost performance.
A third case demonstrates intervention effectiveness. A 750kW retail complex initially operated without M&V protocols, experiencing declining performance similar to the warehouse example. However, after implementing comprehensive monitoring and maintenance programs in year four, performance stabilized at 89% of design specifications for the remaining observation period. While they sacrificed early-year savings, their proactive pivot salvaged long-term value, ultimately achieving 165% ROI by year ten.
These cases quantify a clear pattern: facilities investing 2-4% of system costs annually in M&V activities typically preserve 90-95% of projected savings, while those without systematic oversight frequently experience 25-35% savings erosion. The difference over a decade represents hundreds of thousands in realized versus lost value, fundamentally altering project economics and strategic energy planning.
The reality of commercial solar investment is clear: long-term savings are achievable but never guaranteed. Without structured monitoring, verification, and maintenance protocols, even the most promising solar installations can underperform, eroding anticipated returns and extending payback periods far beyond initial projections.
Organizations that treat solar as a passive investment consistently fail to capture the full financial value of their systems. Degradation goes unnoticed. Performance anomalies remain unaddressed. Utility billing errors accumulate. The gap between projected and actual savings widens with each passing year, transforming what should be a reliable revenue generator into a source of financial uncertainty.
The difference between those who realize substantial long-term returns and those who fall short lies in their commitment to ongoing measurement and verification. Successful solar investments require the same rigor and attention as any critical business asset. This means establishing baseline measurements, implementing continuous monitoring systems, conducting regular performance analyses, and maintaining proactive maintenance schedules.
As you evaluate solar providers for your organization, prioritize those offering comprehensive M&V programs as standard practice rather than optional add-ons. Request detailed documentation of their monitoring protocols, verification methodologies, and long-term support structures. Examine their track record with existing clients and investigate how they’ve sustained savings performance over multi-year periods.
The organizations that achieve decades of sustained solar savings are those that recognize M&V not as overhead but as essential infrastructure protecting their energy investment and ensuring accountability from day one.